

If you followed along with my previous post on getting your professional website set up in Google Search Console, you should have your site verified and your sitemap submitted by now. If you haven’t done that yet, start there. This post picks up where that one left off, showing you how to actually use the data you’ll find there. .
Once Search Console collects data for a few days, you’ll see data appear in your dashboard. The first time you see this, it can feel like a lot.
The good news is you don’t need to understand all of it, especially up-front. For a freelance writer who only needs to monitor their professional website, five areas cover most of what you’ll want to know. Here’s what each one tells you and why it matters.
1. Search Performance
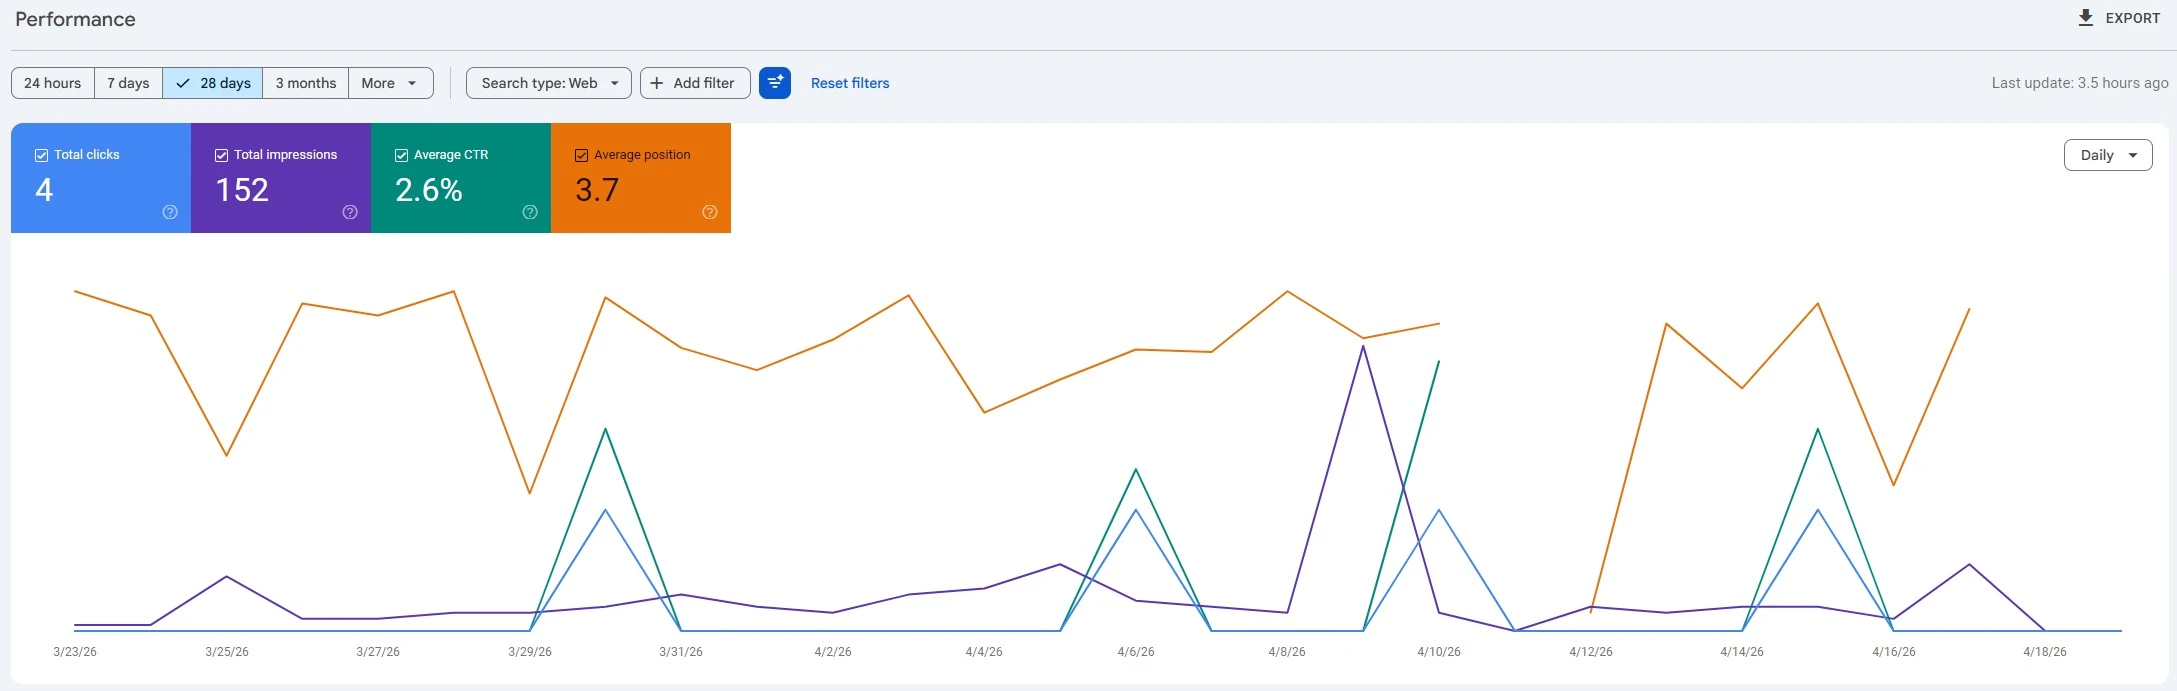
The Performance report is the section you’ll likely visit most. You can find it by clicking “Performance” in the left sidebar. At the top of the page is a graph showing your site’s activity in Google’s search results over time, with four metrics you can toggle on or off: Total Clicks, Total Impressions, Average CTR, and Average Position.
By default, only Clicks and Impressions are turned on. Turn on all four so you can see the full picture at a glance. Or focus in on the one you’re most interested in. For example, I’ll often focus just on impressions when I’m working on improving a site’s visibility in Google’s results. Here’s what the chart might look like with everything toggled on.
Note: This is still using my brand new one-page site, JennMattern.com, as an example, so there isn’t much data available yet even though it’s already performing well in search for my name (the whole point of the site).
Total Clicks
This is how many times someone clicked through to your site from a Google search result. Of the four metrics, this is the most direct measure of whether your search visibility is sending real visitors to your site.
Total Impressions
This is how many times your site appeared in search results, whether or not anyone clicked. A page can rack up thousands of impressions without a single visit, which usually means the way it’s showing up in results isn’t compelling enough to get people to follow through. In that case, it’s a sign you should update your page’s meta description and SEO title (which you can do using the Yoast SEO plugin or similar SEO plugins in WordPress, or manually in a static site in your <head> section.
Average CTR
CTR stands for click-through rate. It’s the percentage of impressions that turned into actual clicks. If your site appeared in search results 200 times and received 10 clicks, your CTR is 5%. A low CTR alongside strong impression numbers points to a title tag or meta description that isn’t doing its job. Remember, the metadata isn’t just descriptive. It should convince searchers to click on your site rather than all the others in their search results.
Average Position
This is your average ranking across all the search queries your site appears for. Position 1 is the top result, so lower numbers are better. Keep in mind it’s an average across your entire site, so a single page ranking unusually well or poorly can skew it.
What to Watch For
Early on, the most useful thing you can do with this data is watch the direction of the trends rather than fixate on the numbers themselves. Are impressions growing over time? Are clicks tracking upward alongside them, or staying flat? Impressions climbing while clicks don’t is a common signal that your content is getting indexed and showing up in results, but something about the listing isn’t landing with searchers. It might be your meta data. Or it might be that your site is ranking for terms that aren’t relevant to your target visitors.
That’s useful to know, and it’s fixable.
2. Queries
Still inside the Performance report, scroll past the graph and you’ll find a data table. The Queries tab is selected by default. It shows you the search terms people typed into Google before your site appeared in their results.
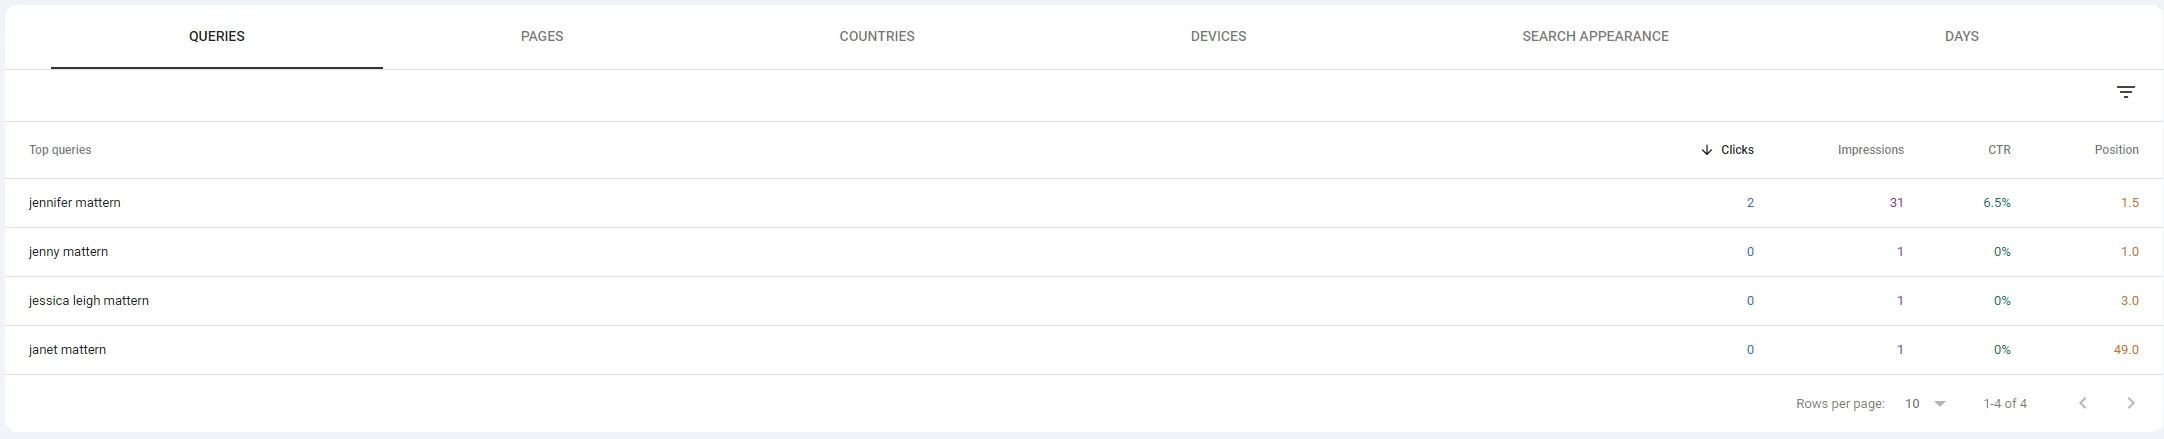
Each row shows a query along with its clicks, impressions, CTR, and position, so you can see not just what terms are bringing people to your site but how each one is performing. For a freelance writer, this tends to be one of the more revealing parts of the whole dashboard.
You might find people landing on your site through searches you never targeted. You might also find that the terms you most want to rank for, the searches a potential client would run when looking for a writer with your background, aren’t showing up at all. Both situations are worth knowing about and they should influence future content strategy decisions.
What to Look For in the Data
Queries with a lot of impressions but low clicks are worth flagging. These are searches where your site is appearing regularly, but something about your listing isn’t converting those views into visits. A stronger title or description on the relevant page can improve that.
Queries already generating consistent clicks deserve attention for a different reason. Those are your working terms. It’s worth making sure the pages those visitors land on are serving them well and pointing toward a way to hire you. Does the page have a clear CTA (call-to-action)? If not, now’s the time to add one.
3. Page Indexing Report
In the left sidebar, look for “Indexing” and then click “Pages” underneath it. This is where Search Console tells you which pages on your site Google has indexed, which it hasn’t, and why.
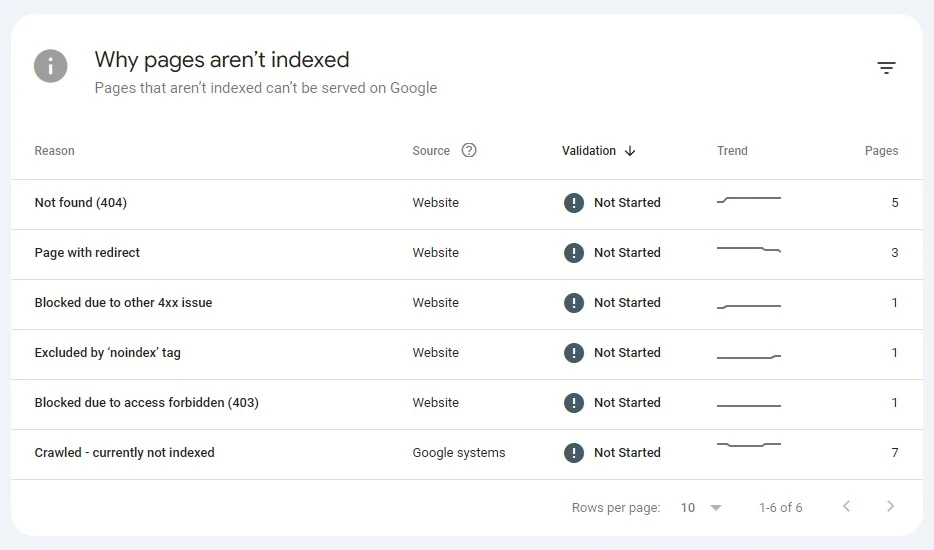
Indexed pages are the ones that can appear in Google’s search results. If a page isn’t indexed, it is invisible to anyone searching on Google, regardless of how good the content is. Specifically scroll down to find the report on why pages aren’t indexed. It should look something like this:
Reading the Status Reasons
Some of what you see here is nothing to worry about. “Crawled – currently not indexed” means Google found the page but hasn’t decided to include it yet, which is common on newer sites or pages with thin content. “Duplicate without user-selected canonical” means Google found pages too similar to each other and chose one to index over the others.
Other statuses are worth investigating. “Excluded by ‘noindex’ tag” means something is telling Google to stay out of that page. That’s sometimes intentional (you may not want certain admin or email subscription thank-you pages indexed), but it’s sometimes a plugin setting or configuration error you’d want to catch. “Page with redirect” simply means the URL redirects somewhere else, which is fine as long as the destination is indexed properly.
So don’t panic about these non-indexed pages. But look for signs of problems you can fix – 404 errors where the page URL should be redirected, solid content that should be manually submitted for indexing, or accidental noindex settings from your SEO plugin.
4. URL Inspection
At the top of any Search Console page, you’ll find a search bar that reads “Inspect any URL in [your domain].” This is the URL Inspection tool, and it’s the next step after spotting an unindexed page in the Pages report.
Type or paste any URL from your site into the bar and hit enter. Search Console pulls up a detailed report on that specific page, including whether Google has indexed it and, if not, the reason why.
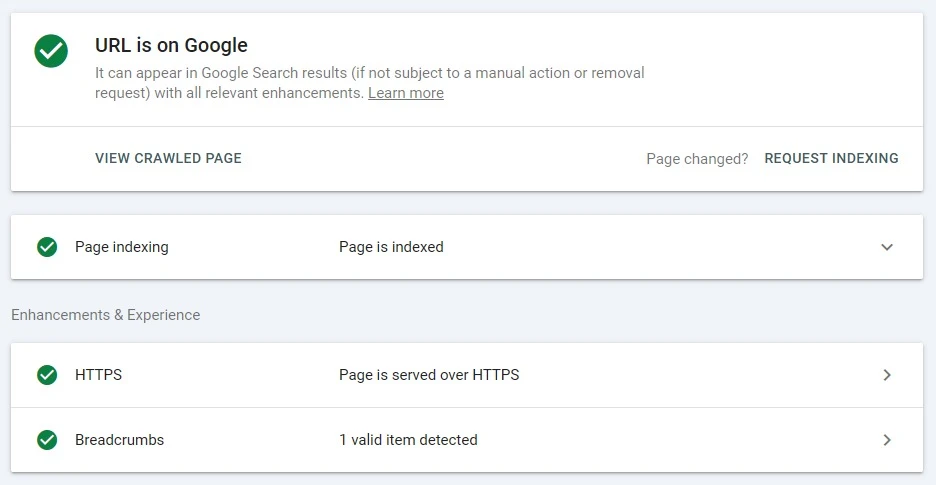
If the page is indexed, you’ll see a confirmation with a green checkmark (like in the screenshot above). If it isn’t indexed, you’ll get an explanation specific to that one URL. This is useful when you want to dig into why a particular page isn’t appearing in search results.
Requesting Indexing
If a page isn’t indexed and you believe it should be without changes, click the “Request Indexing” button on this URL inspection report screen. It tells Google the page is ready to be crawled and considered for inclusion in search results. This doesn’t guarantee anything, but it puts the page in the queue ahead of Google’s regular crawl schedule for your site.
There are a few situations where this comes in handy: when you’ve just published a new page and want Google to find it sooner, when you’ve made significant updates to an existing page and want those changes in search results, or when you’ve resolved an issue on a previously unindexed page and want Google to reconsider indexing it.
Search Console limits how many indexing requests you can submit, so reserve this for pages that actually matter. In my experience, it usually allows me to manually request indexing for 10-15 pages in a day (across all my sites). It’s much more important that you have a correct sitemap submitted via Search Console so Google knows how to crawl your site regularly. Add this by clicking “Sitemaps” in the left navigation bar and entering the URL for your sitemap. (This URL will vary depending on what SEO plugin you’re using if you built your site on WordPress. If you have no SEO plugins, set that up first, and get your sitemap URL from that tool.
5. Core Web Vitals
Core Web Vitals can be found under the “Experience” section in the left sidebar. This report measures how fast and stable your pages feel to real visitors, based on data Google collects from actual users visiting your site over the past 90 days. Just know if your site is new, or if it’s newly set up in Search Console, you might not see data here for a while. The screenshot below is from one of my older sites because the demo one set up at JennMattern.com is still too new to have this report.
Some of the things measured here include loading speed (how quickly the main content of a page renders) and visual stability (whether elements shift around as the page loads). If you’ve ever gone to tap a link on your phone and had it jump right before you touched it, that’s a visual stability problem, and Google tracks it.
In your report, you’ll see a breakdown of how pages perform on both desktop and mobile devices. As you can see here, just because a page works well for a desktop user, it doesn’t mean it performs as well on mobile devices.
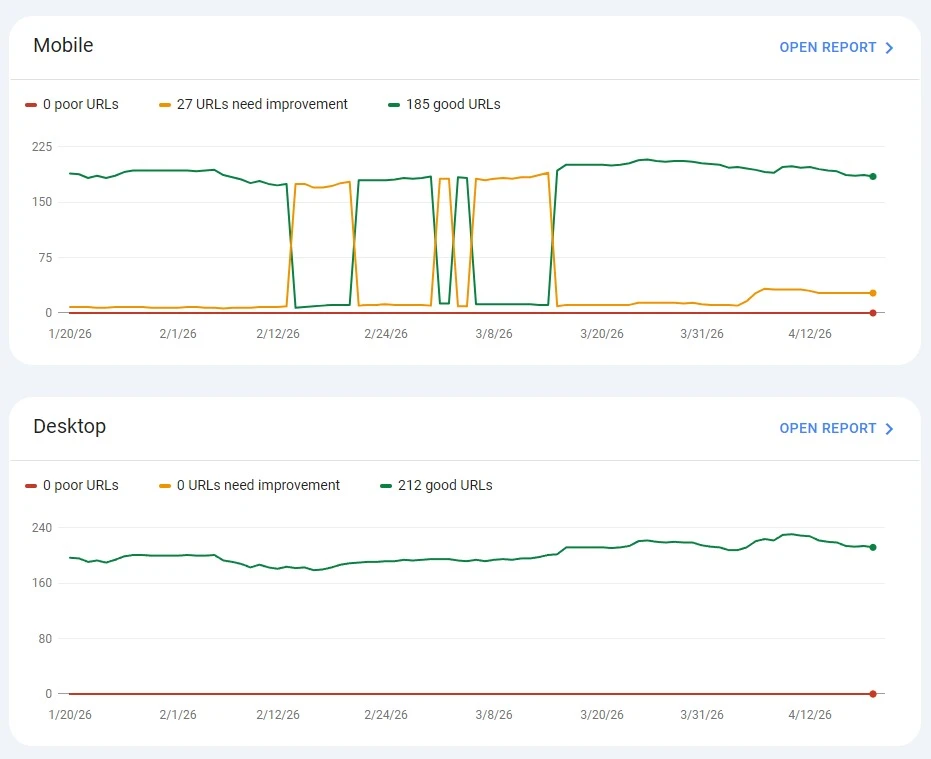
Pages are rated as Good, Needs Improvement, or Poor. Google uses these scores as a ranking signal, so a site with a high count of Poor pages is working against itself in search results.
What to Do With the Data
You don’t need to understand the technical details to get value out of this report. What you’re looking for is whether your pages are landing in Good or whether you have a meaningful number showing as Poor.
If you do have pages in the Poor category, that warrants more attention. Common culprits are slow shared hosting, large unoptimized images, and heavy page builder themes. You don’t need to fix these things yourself, but knowing the problem exists puts you in a position to get it addressed by your host, a consultant or developer you hire, or on your own with some guidance (like optimizing images too large to serve to mobile devices).
Checking In on Your Data
Search Console doesn’t require daily attention for something like a freelancer’s professional website. Checking in once or twice a month is enough to stay on top of what’s happening. The value is in catching problems early, watching the direction your numbers are moving, and getting a clear read on whether your site is doing what it’s supposed to: helping the right people find you via Google.
In a future post or newsletter, I’ll go deeper into how to use some of this data. In the meantime, if you haven’t set up Search Console yet, follow my Google Search Console setup guide to get started.